Check your data!
It’s vitally important that you’re constantly checking your data. Especially after commands that create new data or change existing data. Students who don’t check their data often end up making mistakes.
- Checking the number of rows and columns
- Checking the structure of a dataframe
- Tabulating a variable
- Summarizing a numerical variable
Checking the number of rows and columns
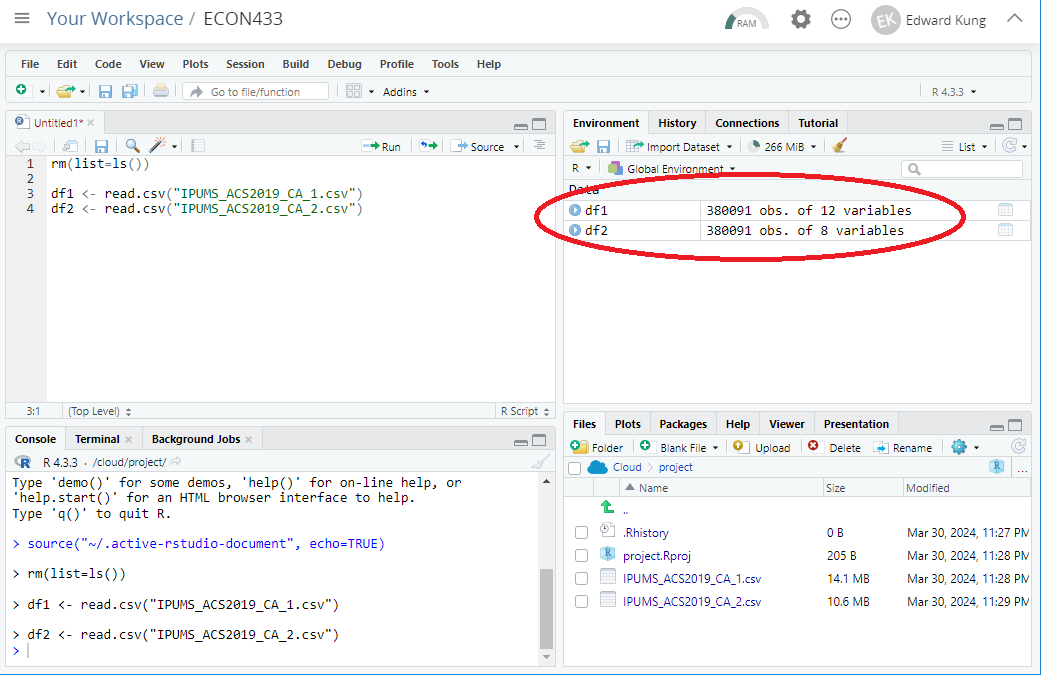
You can easily check the number of rows (observations) and columns (variables) for each dataframe in your environment by looking at the Environment pane.

Checking the structure of a dataframe
You can check the structure of a dataframe named df by using the following command:
str(df)
The output will list the following information:
- The number of observation (rows) and the number of variables (columns)
- For each variable in the dataframe, it shows:
- The name of the variable
- The variable’s data type
- The value of that variable on the first few rows
Example output:
> str(df1)
'data.frame':	380091 obs. of  12 variables:
 $ YEAR     : int  2019 2019 2019 2019 2019 2019 2019 2019 2019 2019 ...
 $ SERIAL   : int  70293 70294 70295 70296 70297 70298 70299 70300 70301 70302 ...
 $ PERNUM   : int  1 1 1 1 1 1 1 1 1 1 ...
 $ PERWT    : int  21 34 28 127 103 6 4 81 16 58 ...
 $ STATEFIP : int  6 6 6 6 6 6 6 6 6 6 ...
 $ COUNTYFIP: int  37 73 59 71 89 37 111 37 111 29 ...
 $ AGE      : int  58 66 18 58 18 65 21 54 82 38 ...
 $ SEX      : int  2 1 2 1 2 1 1 2 2 1 ...
 $ MARST    : int  6 4 6 6 6 6 6 6 2 6 ...
 $ RACHSING : int  2 1 1 1 1 2 5 1 5 5 ...
 $ EMPSTAT  : int  2 3 3 3 3 3 1 3 3 3 ...
 $ INCWAGE  : int  23100 0 6000 0 2000 0 9800 0 0 0 ...
Checking the structure of a dataframe is a very useful debugging tool. Students sometimes make mistakes which lead a dataframe to have zero rows or the wrong columns. Checking the structure of a dataframe with str can help you realize you made a mistake.
Tabulating a variable
You can tabulate a variable called var in a dataframe called df with the following command:
table(df$var)
(To tabulate a different variable or use a different dataframe, simply substitute the correct names in var and df.)
The output will show:
- For each possible value of
var, how many rows indfhave that value.
Example output:
> table(df1$RACHSING)

     1      2      3      4      5
166724  19973   1820  63415 128159
Tabulating a variable tells us two important pieces of information:
- What possible values the variable could have.
- How many rows in the data have each possible value.
Tabulating is also useful for debugging. Students sometimes make a mistake which causes a variable to have only one value, which is not what they wanted. Tabulating the variable helps you catch such mistakes.
Summarizing a numerical variable
To summarize variable var in dataframe df, use this command:
summary(df$var)
(To summarize a different variable or use a different dataframe, simply substitute the correct names in var and df.)
The behavior of summary depends on the type of the variable.
- For
int(integer) andnum(numeric) data types,summarywill output information about the mean, median, and percentiles. - For
factor(categorical) andlogi(boolean) data types,summarywill behave liketableby tabulating the values.
Example output for numeric data type:
> summary(df1$INCWAGE)
   Min. 1st Qu.  Median    Mean 3rd Qu.    Max.
      0       0   25000  206215  107000  999999
Summarizing a variable is useful for getting a sense of the typical range of values that it has. You can also use that information to check whether the range makes sense.
tableandsummaryare best used to check if you have mistakes in your data, but they will not produce accurate statistics if the data is a stratified sample. See the vignette on computing summary statistics for instructions on how to compute accurate summary statistics in stratified samples.