Application: Labor-Leisure Choice
- Labor-leisure choice
- General setup
- First order conditions
- Graphical analysis
- Analysis of social welfare policies
Labor-leisure choice
If your hourly wage increases, will you work more hours or less hours?
The answer is that it depends on your relative tradeoff between consumption and leisure. On the one hand, a higher wage rate means you earn more for each hour worked, which could incentivize you to work more. On the other hand, a higher wage rate means you can enjoy the same level of consumption while working less.
Economists model the decision of how many hours to work and how many to rest using “labor-leisure choice models.”
General setup
An individual can work for up to \(H\) hours a week at an hourly wage rate of \(w\). The person has utility over weekly consumption \(c\) and weekly leisure hours \(\ell\) given by \(u(c,\ell)\).
The consumer’s optimization problem is:
\[\max_{c, \ell} ~ u(c, \ell) ~ \text{ s.t. } ~ c = wh ~ \text{ and } ~ h = H - \ell\]The budget constraint simply says that the weekly consumption is equal to the wage rate times the number of hours worked \(h\).
First order conditions
This is a constrained multivariate optimization problem, which we can solve by writing down the first order conditions with respect to \(c\) and \(\ell\).
First, let’s write the budget constraint as a single constraint:
\[c + w\ell = Hw\]The maximization problem becomes:
\[\max_{c, \ell} ~ u(c, \ell) ~ \text{ s.t. } ~ c + w\ell = Hw\]The first order conditions are:
\[\begin{align} u_c(c, \ell) &= \lambda \\ u_\ell(c, \ell) &= w \lambda \end{align}\]If we divide the two equations we get:
\[\frac{u_\ell(c, \ell) }{u_c(c,\ell)} = w\]This says that at the optimal choice of labor and leisure, the wage rate is equal to the marginal rate of substitution between leisure and consumption.
Economic Insight
Workers optimize their utility when the wage rate is equal to the marginal rate of substitution between leisure and consumption.
Example 1
An individual can work for up to 60 hours a week at an hourly wage rate of \(w = 40\). The person has utility over weekly consumption \(c\) and weekly leisure hours \(\ell\) given by:
\[u(c, \ell) = c^{2/3} \ell^{1/3}\]Find the optimal choice between consumption and leisure.
Answer.
Step 1. Write down the optimization problem.
\[\max_{c,\ell} ~ c^{2/3} \ell^{1/3} ~ \text{ s.t. } ~ c + 40\ell = 2400\]Step 2. Write down the first order conditions:
\[\begin{align} \frac{2}{3} c^{-1/3} \ell^{1/3} &= \lambda \\ \frac{1}{3} c^{2/3} \ell^{-2/3} &= 40 \lambda \end{align}\]Step 3. Divide the two first order conditions:
\[\begin{align} \frac{\frac{1}{3} c^{2/3} \ell^{-2/3}}{\frac{2}{3} c^{-1/3} \ell^{1/3}} &= 40 \\ \frac{c}{2\ell} &= 40 \\ c &= 80 \ell \end{align}\]Step 4. Plug \(c = 80 \ell\) into the budget constraint.
\[\begin{align} c + 40 \ell &= 2400 \\ 80\ell + 40 \ell &= 2400 \\ 120 \ell &= 2400 \\ \ell &= 20 \end{align}\]The optimal labor-leisure choice is therefore to work 40 hours a week and have 20 hours of leisure time. The total weekly consumption is \(c = 40h = 40(40) = 1600\).
Graphical analysis
We can also represent labor-leisure choice models using indifference curves and budget constraints. This is particularly useful for thinking about changes to the wage rate or budget constraint.
Example 2
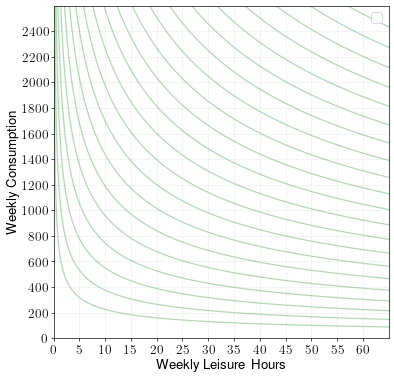
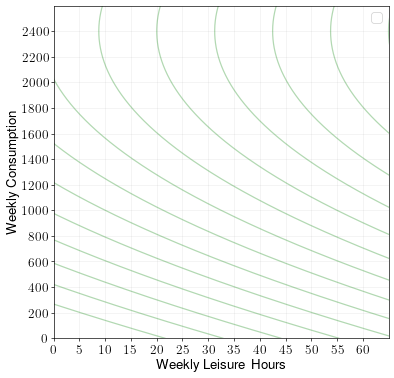
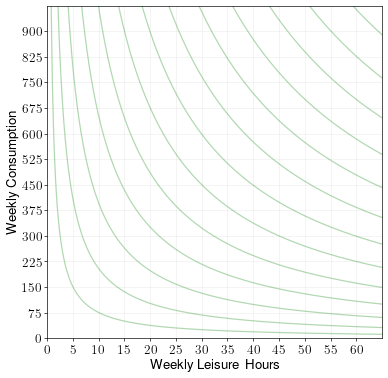
A person can work for up to 60 hours a week. They have utility over weekly consumption \(c\) and weekly leisure hours \(\ell\) given by the following indifference curves:
Draw the budget constraint and find the optimal choice of consumption/leisure when the hourly wage rate is \(w = 30\). Label the optimal point A.
Draw the budget constraint and find the optimal choice of consumption/leisure when the hourly wage rate is \(w = 40\). Label the optimal point B.
How did the change in wage rate affect consumption and hours worked?
Answer.
To draw the budget constraint in a labor-leisure choice model, draw a straight line from the maximum consumption to the point with 0 consumption and max leisure.
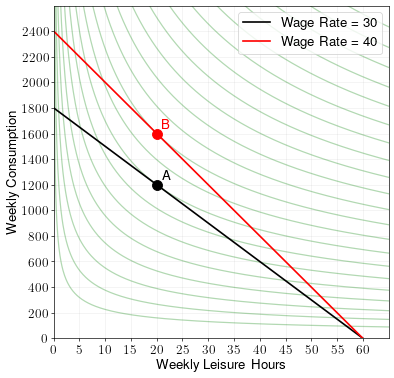
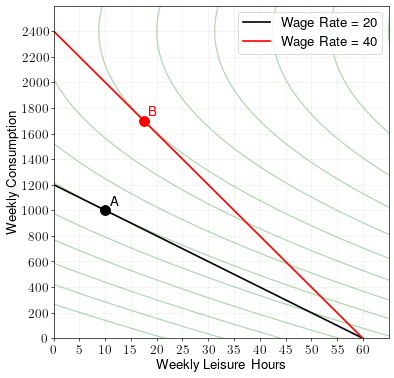
If we draw these two budget constraints on the graph, we get:
Leisure hours are the same under both wage rates. Thus, the increase in wage rate did not change the number of hours worked. However, consumption did increase when the wage rate increased.
This example therefore shows why some people may continue to work the same number of hours every week regardless of whether their wage rate increases or decreases.
Example 3
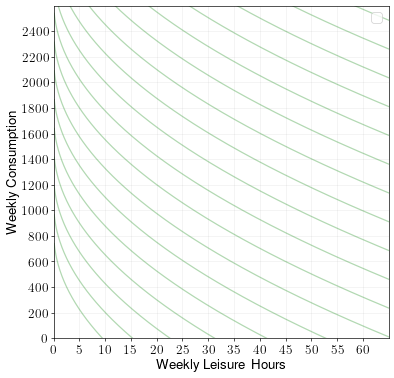
A person can work for up to 60 hours a week. They have utility over weekly consumption \(c\) and weekly leisure hours \(\ell\) given by the following indifference curves:
Draw the budget constraint and find the optimal choice of consumption/leisure when the hourly wage rate is \(w = 30\). Label the optimal point A.
Draw the budget constraint and find the optimal choice of consumption/leisure when the hourly wage rate is \(w = 40\). Label the optimal point B.
How did the change in wage rate affect consumption and hours worked?
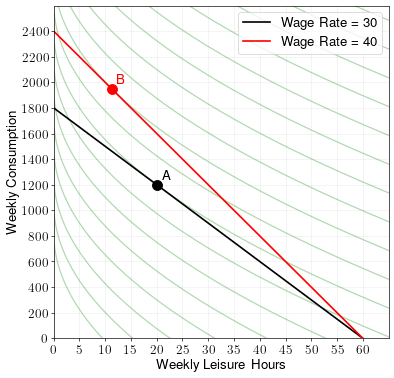
Answer.
In this case, the increase in wage rate leads to more work hours and less leisure hours.
Example 4
A person can work for up to 60 hours a week. They have utility over weekly consumption \(c\) and weekly leisure hours \(\ell\) given by the following indifference curves:
Draw the budget constraint and find the optimal choice of consumption/leisure when the hourly wage rate is \(w = 20\). Label the optimal point A.
Draw the budget constraint and find the optimal choice of consumption/leisure when the hourly wage rate is \(w = 40\). Label the optimal point B.
How did the change in wage rate affect consumption and hours worked?
Answer.
In this case, the increase in wage rate leads to less work hours and more leisure hours.
Economic Insight
An increasing wage rate can lead to an increase, decrease, or no change in the number of hours worked. It all depends on an individual’s preferences!
Warning
The analysis above is for a single individual. It’s possible that an increase in the wage rate simultaneously causes people to work less hours, but also draws more people into the labor force. Thus, the total labor supply may increase even as individual people work shorter hours.
In the end, how changes to the wage rate affect individual and total labor supply is an empirical question.
Analysis of social welfare policies
We can use labor-leisure choice models to assess the impact of social welfare policies.
Example 5
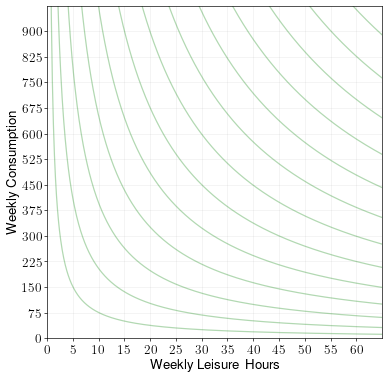
A person can work for up to 60 hours a week at an hourly wage rate of \(w = 15\). They have utility over weekly consumption \(c\) and weekly leisure hours \(\ell\) given by the following indifference curves:
Draw the budget constraint and find the optimal choice of consumption/leisure. Label the optimal point A.
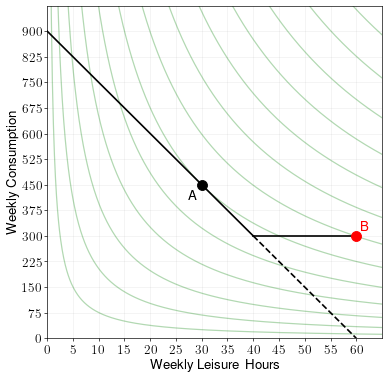
Now suppose there is a supplemental income policy which raises a person’s weekly income to \(525\) if they make less than \(525\) a week. Draw the budget constraint and find the optimal choice of consumption/leisure. Label the optimal point B.
Does the supplemental income policy increase or decrease consumption and hours worked?
Answer.
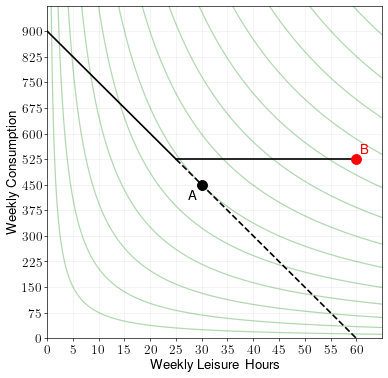
The supplemental income policy makes it so that the budget constraint never goes below a consumption of 525, regardless of number of hours worked. In the graph below, we represent the budget constraint without welfare as a dotted line and the budget constraint with welfare as a solid line.
In this example, the supplemental income policy increases consumption but reduces the number of hours worked.
Example 6
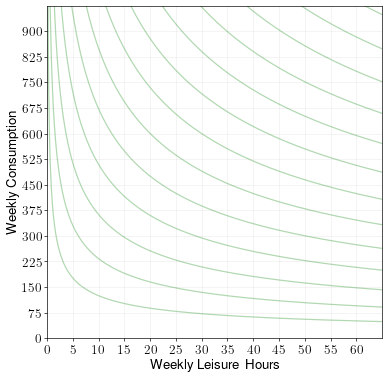
A person can work for up to 60 hours a week at an hourly wage rate of \(w = 15\). They have utility over weekly consumption \(c\) and weekly leisure hours \(\ell\) given by the following indifference curves:
Draw the budget constraint and find the optimal choice of consumption/leisure. Label the optimal point A.
Now suppose there is a supplemental income policy which raises a person’s weekly income to \(300\) if they make less than \(300\) a week. Draw the budget constraint and find the optimal choice of consumption/leisure. Label the optimal point B.
Does the supplemental income policy increase or decrease consumption and hours worked?
Answer.
In this example, the supplemental income policy actually reduces consumption while also reducing the number of hours worked.
Example 7
A person can work for up to 60 hours a week at an hourly wage rate of \(w = 15\). They have utility over weekly consumption \(c\) and weekly leisure hours \(\ell\) given by the following indifference curves:
Draw the budget constraint and find the optimal choice of consumption/leisure. Label the optimal point A.
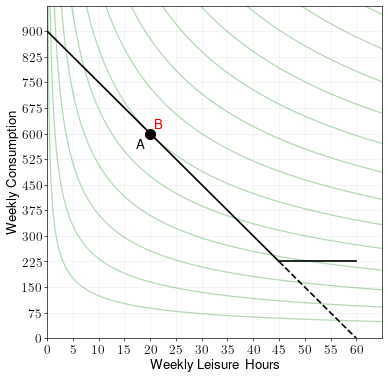
Now suppose there is a supplemental income policy which raises a person’s weekly income to \(225\) if they make less than \(225\) a week. Draw the budget constraint and find the optimal choice of consumption/leisure. Label the optimal point B.
Does the supplemental income policy increase or decrease consumption and hours worked?
Answer.
In this example, the supplemental income policy doesn’t change the worker’s behavior.
In the above examples, we saw three possible outcomes:
- The welfare policy led to more consumption but fewer hours worked.
- The welfare policy led to less consumption and fewer hours worked.
- The welfare policy led to no change in hours worked or consumption.
Economic Insight
Income support policies can lead to a number of different effects depending on an individual’s preferences over labor and leisure. It can even lead to both fewer hours worked and less consumption.
Ultimately, the effect of any particular welfare policy needs to be assessed empirically.
