Labor/Leisure Choice
In this lecture, we’ll apply concepts from consumer choice theory to explain peoples’ decisions on how much to work. These are known as labor/leisure choice models because the decision being made is how to split your time between working (labor) and not working (leisure).
General Setup
A worker can work up to a maximum of \(H\) hours per week. For every hour worked, the worker makes a wage of \(w\) dollars per hour, which he spends on consumption. If the worker spends \(c\) dollars on consumption per week and spends \(\ell\) hours on leisure, he gets a utility of \(u(c,\ell)\).
The worker’s optimization problem is to choose hours worked, \(h\), and hours of leisure, \(\ell\) to maximize their utility:
\[\max_{h,\ell} ~ u(c,\ell) ~ \text{s.t.} ~ c = wh ~ \text{and} ~ h+\ell = H\]The constraint \(c=wh\) simply says that the amount the worker consumes is equal to their hourly wage times their hours worked.
The constraint \(h + \ell = H\) simply says that their total hours add up to the weekly maximum.
Although these models can be set up with equations and solved using the principles of constrained multivariate optimization, we’ll primarily be using the graphical method.
Example
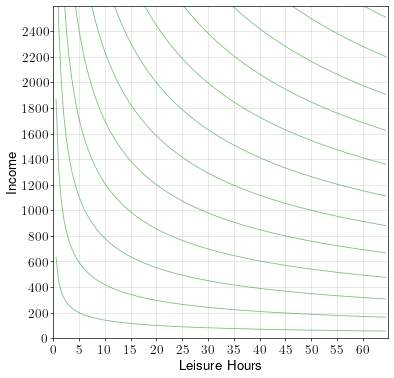
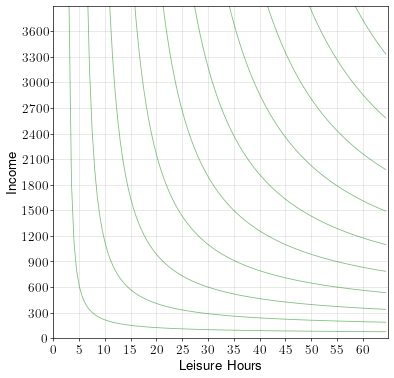
A worker has up to 60 hours a week to spend on working or on leisure. If he works, he makes a wage rate of \(w=30\) dollars per hour. The worker’s indifference curves over leisure and income are shown in the diagram below.
- Draw the worker’s budget constraint and label the optimal point A.
- How many hours a week does the worker work?
- How much income per week does the worker make?
Answer.
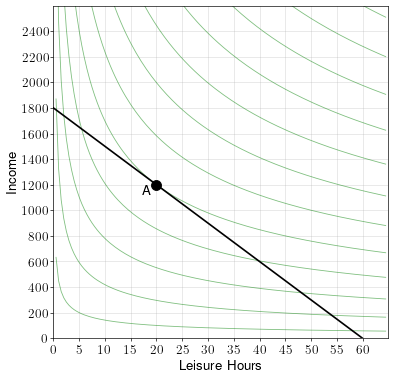
To draw the budget constraint, we first note that the \(x\) intercept must be 60, because the maximum leisure hours per week is 60.
To get the \(y\) intercept, we note that the maximum income happens when the worker works all 60 hours. He’ll make an income of \(60w = 1,800\).
To draw the budget constraint, we simply connect the \(x\) and \(y\) intercepts.
In this example, the worker spends 20 hours per week on leisure, which means he works 40 hours a week and makes a weekly income of 1,200.
Application: Response to wage changes
The labor/leisure model can be used to help us understand how workers respond to changes in their hourly wage.
Wage Change Example 1
A worker has up to 60 hours a week to spend on working or on leisure. If he works, he makes a wage rate of \(w=15\) dollars per hour. The worker’s indifference curves over leisure and income are shown in the diagram below.
One day, the worker’s hourly wage changes to \(w^\prime = 40\).
- Draw the worker’s budget constraint at both the initial wage and the subsequent wage. Label the optimal point at the initial wage A and the optimal point at the new wage B.
- How many hours does the worker work at the initial wage?
- How many hours does the worker work at the new wage?
- Does the wage change increase or decrease the number of hours worked?
Answer.
The maximum leisure is always 60. The maximum income at the initial wage is \(60\times15=900\), and the maximum income at the new wage is \(60\times40=2,400\). Thus, the diagram with both budget constraints shown is:
At the initial wage, the worker works 40 hours (20 hours leisure). At the new wage, the worker works 45 hours (15 hours leisure).
The rise in wage increased the number of hours worked.
Wage Change Example 2
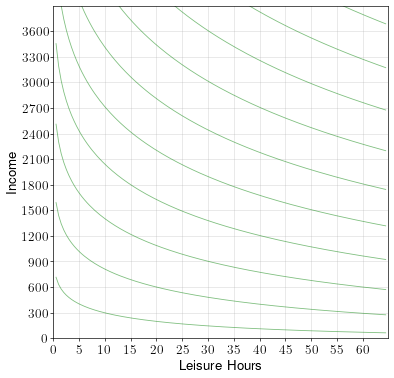
A worker has up to 60 hours a week to spend on working or on leisure. If he works, he makes a wage rate of \(w=20\) dollars per hour. The worker’s indifference curves over leisure and income are shown in the diagram below.
One day, the worker’s hourly wage changes to \(w^\prime = 60\).
- Draw the worker’s budget constraint at both the initial wage and the subsequent wage. Label the optimal point at the initial wage A and the optimal point at the new wage B.
- How many hours does the worker work at the initial wage?
- How many hours does the worker work at the new wage?
- Does the wage change increase or decrease the number of hours worked?
Answer.
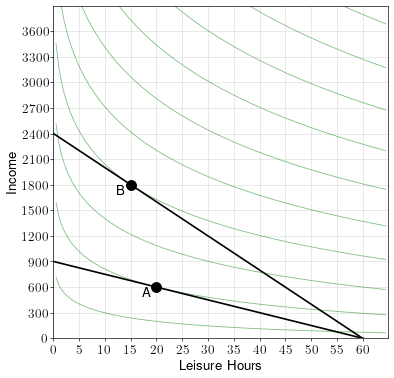
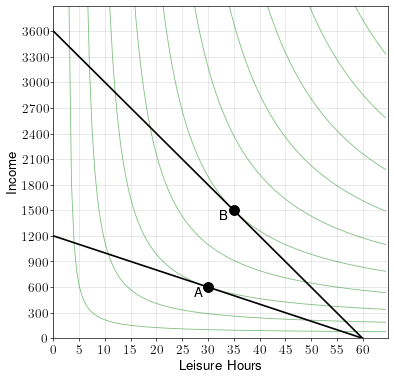
The maximum leisure is always 60. The maximum income at the initial wage is \(60\times20=1,200\), and the maximum income at the new wage is \(60\times60=3,600\). Thus, the diagram with both budget constraints shown is:
At the initial wage, the worker works 30 hours (30 hours leisure). At the new wage, the worker works 25 hours (35 hours leisure).
The rise in wage decreased the number of hours worked.
Economic Insight
In response to a wage increase, workers could work more or they could work less. It all depends on their preferences over consumption vs. leisure.
It might feel strange to talk about working more or less hours depending on the wage. Most full time workers will work about 40 hours a week regardless of the wage rate, and salaried workers don’t get paid by the hour.
However, the results of the labor/leisure model may still show up in how hard someone is willing to work, how many unpaid sick days they take, or how hard they work to try and get the next promotion.
Application: Income support policies
An income support policy is a policy that gives money to people whose incomes fall below a certain level. A much debated question in economics is whether or not income support policies disincentivize work. The labor/leisure model can help answer such questions.
Income support policies example 1
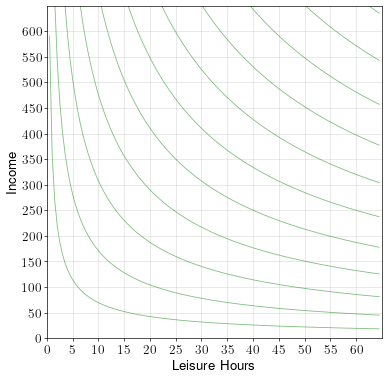
A worker has up to 60 hours a week to spend on working or on leisure. If he works, he makes a wage rate of \(w=10\) dollars per hour. The worker’s indifference curves over leisure and income are shown in the diagram below.
In addition, the government provides minimum income support of up to \(250\) dollars a week. That is, if someone earns less than \(250\) dollars a week, the government supplements their income until it reaches \(250\) a week.
- Draw the budget constraint without income support and label the optimal point A.
- Draw the budget constraint with income support and label the optimal point B.
- Does the income support policy increase or decrease hours worked?
- Does the income support policy increase or decrease the worker’s income?
Answer.
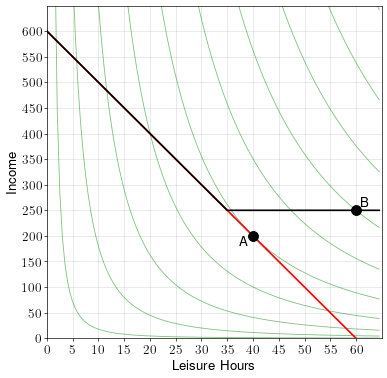
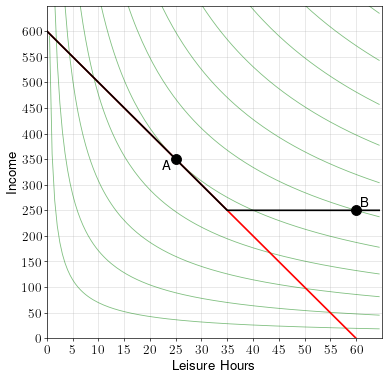
To draw the budget constraint without income support, simply draw a straight line from the \(y\)-intercept of \(60\times10 = 600\) to the \(x\)-intercept of \(60\).
To draw the budget constraint with income support, note that if at any time the person’s income goes below \(250\), it is instead raised to \(250\). This means that there is an income floor at \(250\). So draw a horizontal line at \(y=250\) wherever the original budget constraint is below \(250\).
The red line above shows the budget constraint without income support. The optimal point is A, where it is tangent to the indifference curves. At that point, the worker works 20 hours and earns 200 weekly income.
The black line shows the budget constraint with income support. Point B is optimal because it is the highest indifference curve touching the budget constraint.
Based on this analysis, the provision of minimum income support reduces the number of hours worked, but increases the worker’s income.
Income support policies example 2
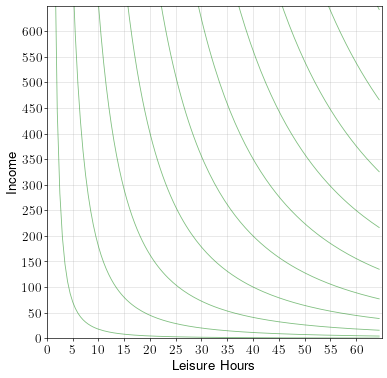
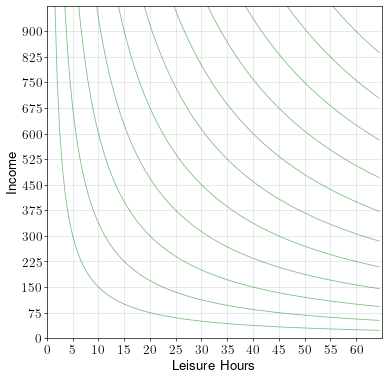
A worker has up to 60 hours a week to spend on working or on leisure. If he works, he makes a wage rate of \(w=10\) dollars per hour. The worker’s indifference curves over leisure and income are shown in the diagram below.
In addition, the government provides minimum income support of up to \(250\) dollars a week. That is, if someone earns less than \(250\) dollars a week, the government supplements their income until it reaches \(250\) a week.
- Draw the budget constraint without income support and label the optimal point A.
- Draw the budget constraint with income support and label the optimal point B.
- Does the income support policy increase or decrease hours worked?
- Does the income support policy increase or decrease the worker’s income?
Answer.
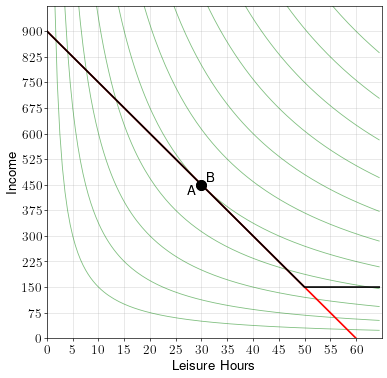
We can repeat the process as with the previous example. We get the following diagram:
The setup was the same, the only difference was that this worker has different indifference curves.
Based on this analysis, minimum income support reduces the number of hours worked and reduces the income of this worker.
Income support policies example 3
A worker has up to 60 hours a week to spend on working or on leisure. If he works, he makes a wage rate of \(w=15\) dollars per hour. The worker’s indifference curves over leisure and income are shown in the diagram below.
In addition, the government provides minimum income support of up to \(150\) dollars a week. That is, if someone earns less than \(150\) dollars a week, the government supplements their income until it reaches \(150\) a week.
- Draw the budget constraint without income support and label the optimal point A.
- Draw the budget constraint with income support and label the optimal point B.
- Does the income support policy increase or decrease hours worked?
- Does the income support policy increase or decrease the worker’s income?
Answer.
This time, the provision of minimum income support does not change the worker’s decision to work. The income support offered is too low, and results in lower utility than if the worker continues his same working hours from before.
Economic Insight
Income support policies, such as TANF, can potentially disincentivize people from looking for work or from working more hours. In some cases, it can even cause a person’s income to decline. Therefore, when designing welfare policies, lawmakers should be aware of the tradeoffs between helping those in need and disincentivizing work.